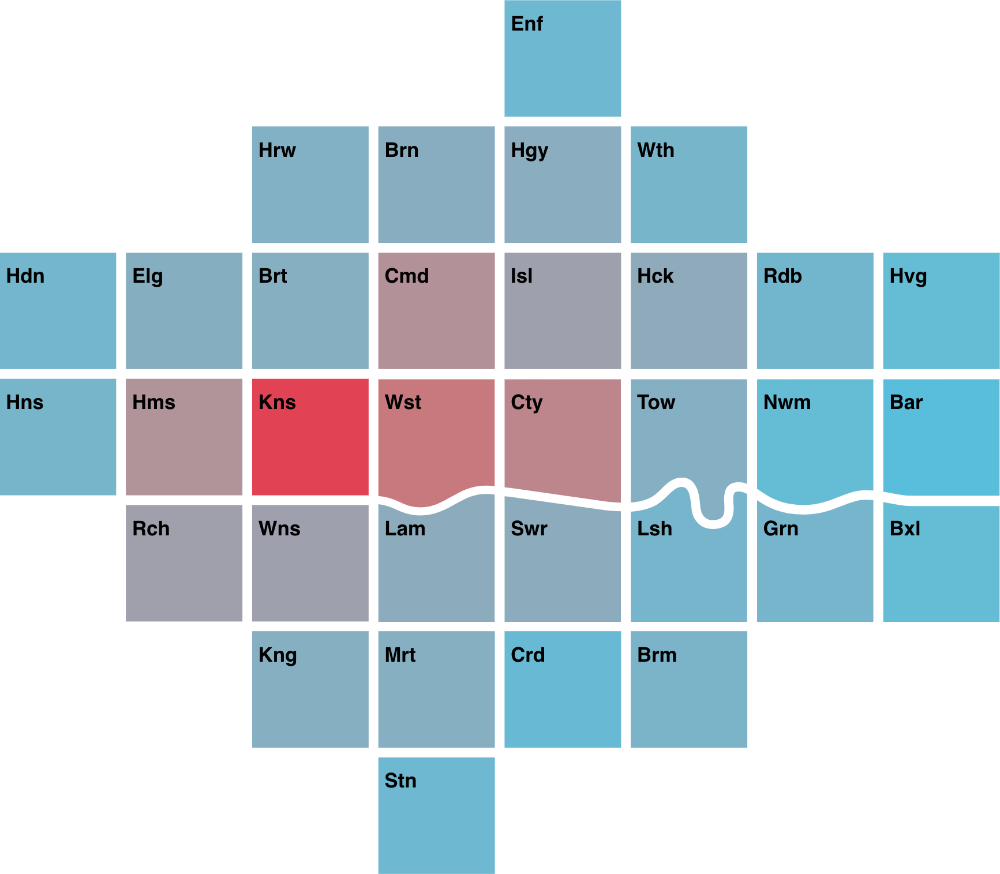
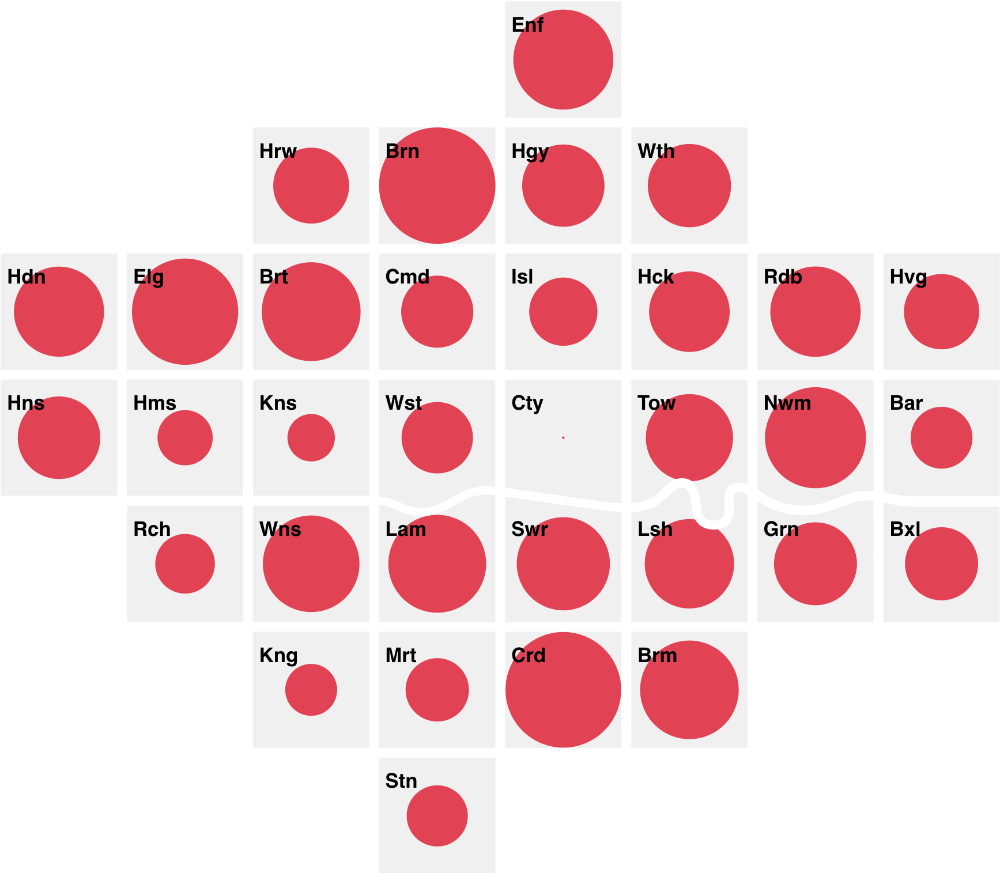
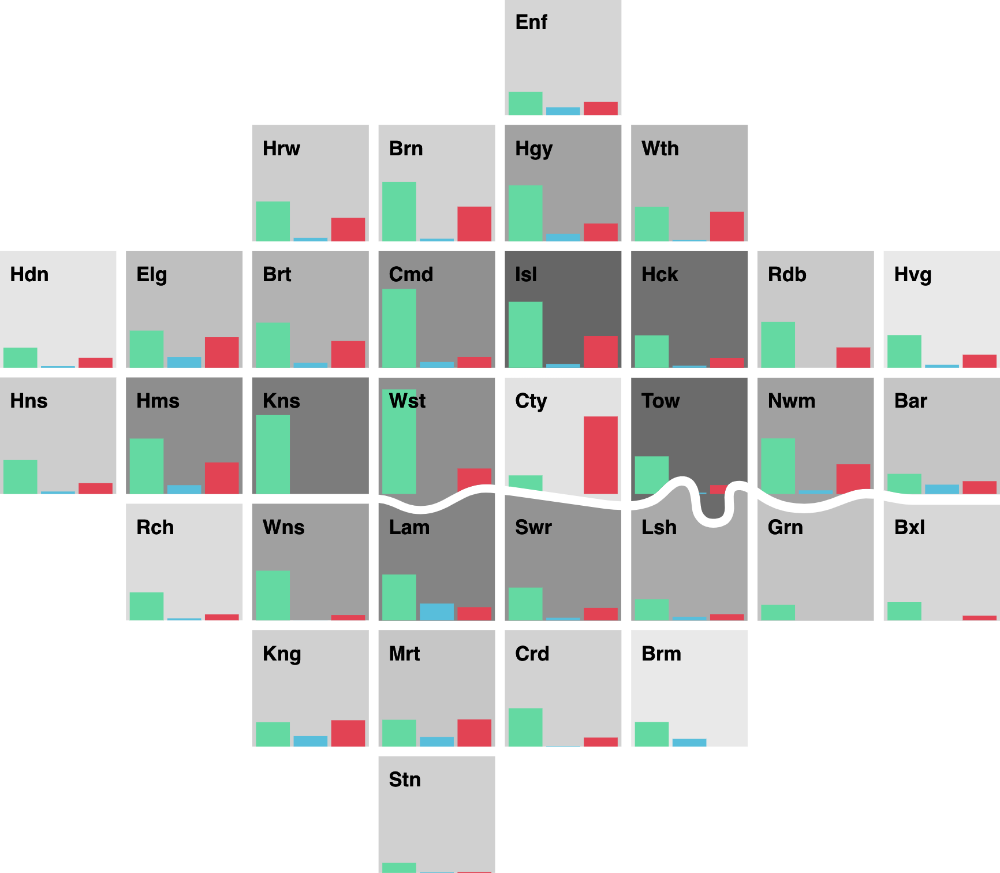
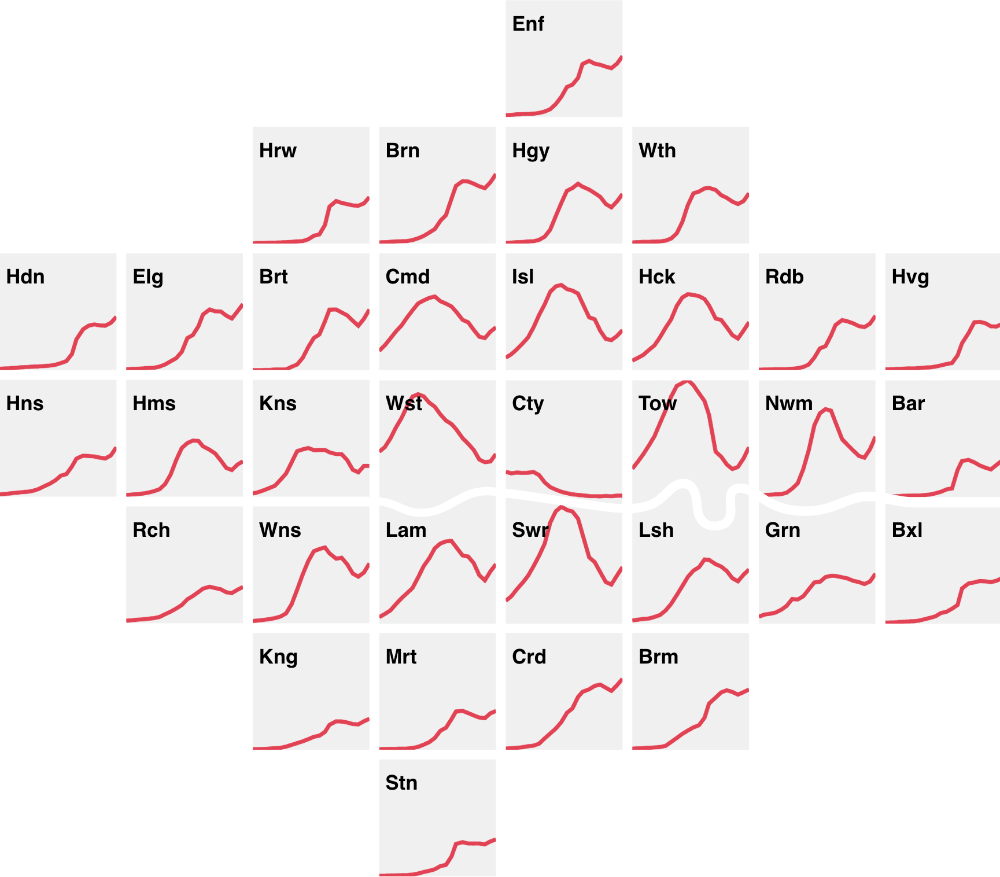
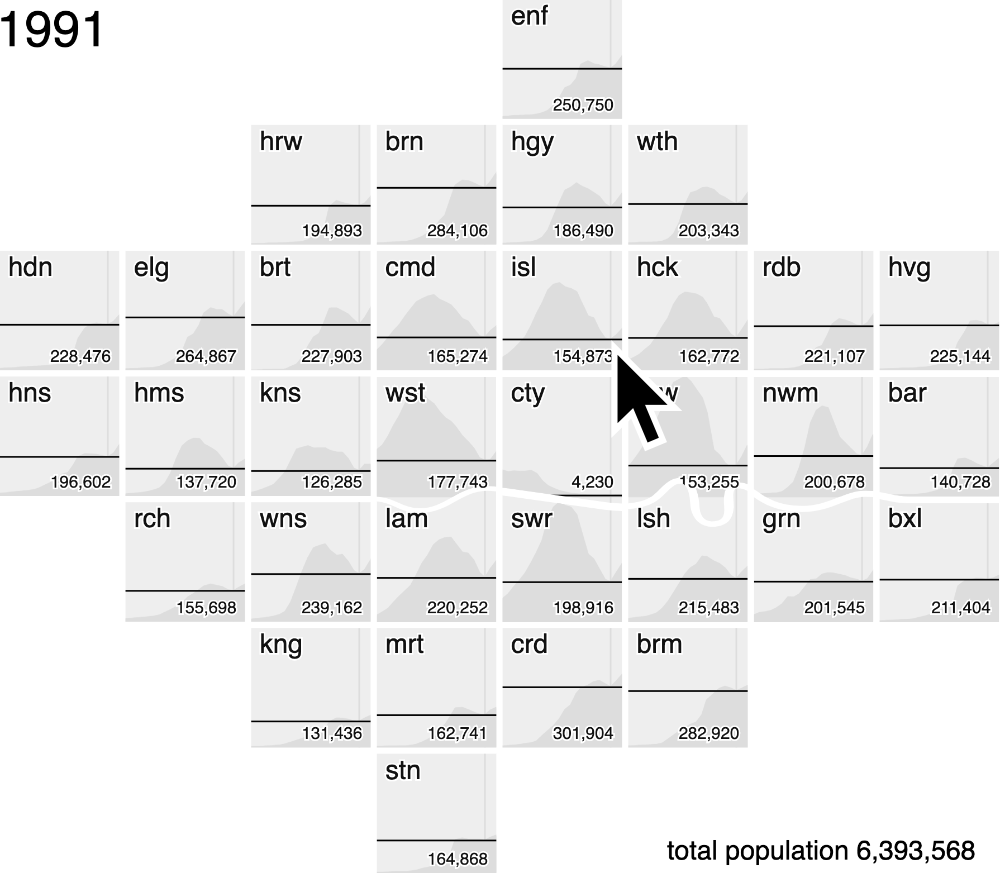
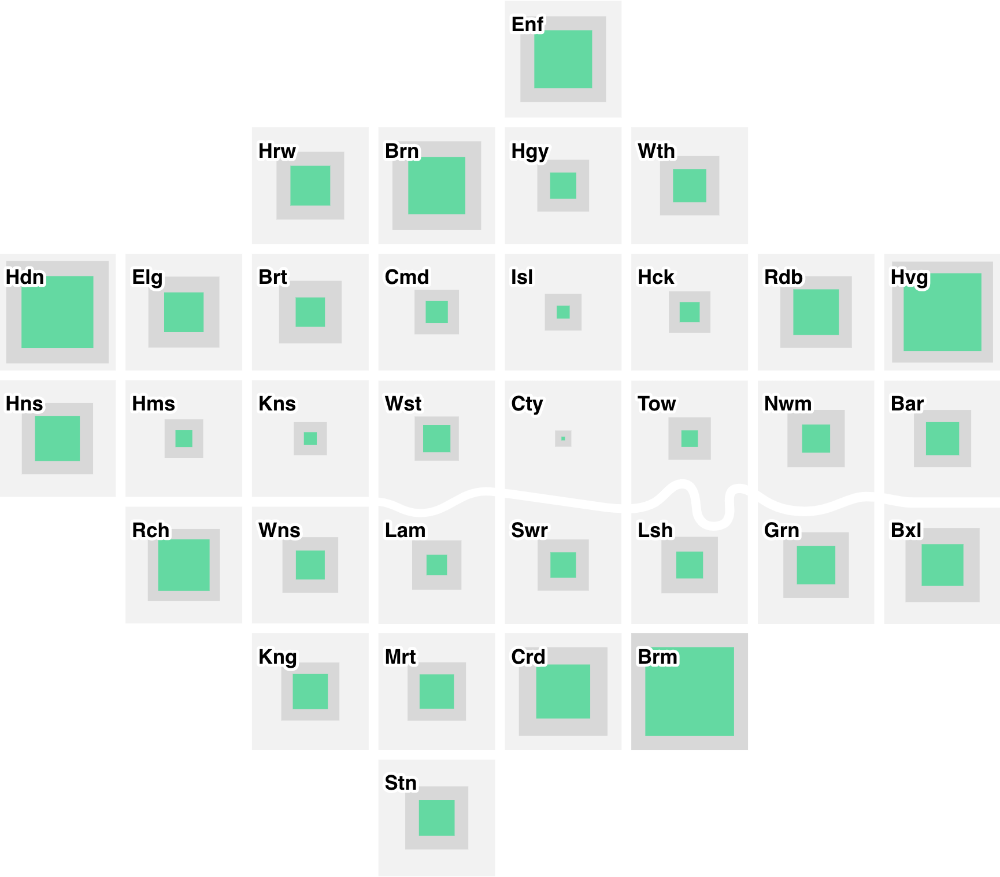
A D3 module to support the creation of London Squared cartograms.
Examples
Release notes
v0.3.2 : dependency security fix v0.3.1 : dependency security fix
About us
After the flood is a design consultancy based in London. We work with global corporations like Google, Nikkei and Ford to solve business problems that combine our understanding of AI and data as a material with unique user insight. Our consulting model means guaranteed access to our top team. Our approach is user-centred and lean, showing progress to clients and working with a variety of expert partners.